An Introduction to Power Query Editor
Post Tags: User Interface | Power Query | See all tags
This post was made with the February 2024 version of Power BI Desktop.
This post is an introduction to Power Query Editor.
We won’t get into too much detail about the nitty-gritty of each part of Power Query in this post. The Power Query tool is extremely powerful (and even has it’s own programming language), so we’ll have lots of posts about what it can do, but for now, we’ll start with a broad overview.
This post (and video below) uses a new blank Power BI report and connects some simple data to introduce Power Query Editor. To download the source Excel data file this report uses to try out what I do in this post and video, here is the data file you can connect to Power BI Desktop:
Here’s the video. The written version is below the video.
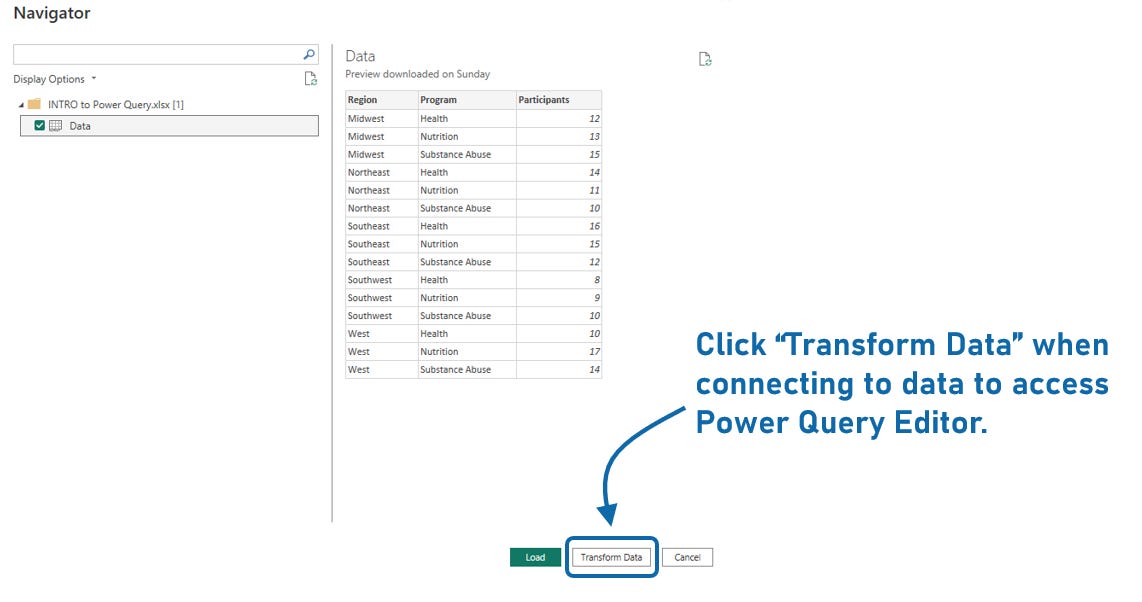
We’ll start off with a blank Power BI report and connect a small simple Excel file (you can download the Excel file above the video above) but when we see our Navigator window where we can see a preview of our data, instead checking our data on the left and clicking the green Load button, if we click the Transform Data button, our data opens in Power Query Editor.
That’s one way of accessing Power Query Editor. We’ll talk about two other ways of accessing it in a couple minutes.
Let’s talk about the basics of Power Query Editor. The name makes it sound really advanced. Power is a powerful word. Query is a very data-geeky word. Editing is about changing things.
This IS a very advanced and complicated part of Power BI, and it can do just about any data transformation you need, but it can also be super EASY for beginners.
The main thing (and really the only thing) you need to know when starting to use Power Query Editor is that what it does is apply rules for how Power BI reads your data source.
Do you need Power BI to ignore some of the rows or columns in your data source? This is where you can tell it what to ignore.
Do you need Power BI to remove duplicate rows when puling data from a data source? This is where you can remove duplicates when the data connects to your data source.
Those are just 2 examples.
It’s best to think about Power Query as a translation tool, or a bridge, to Power BI. You can tell Power BI how to read your data source. You can change how it reads your data source without any changes being done to your data source. You’re just giving Power BI rules for reading that data source.
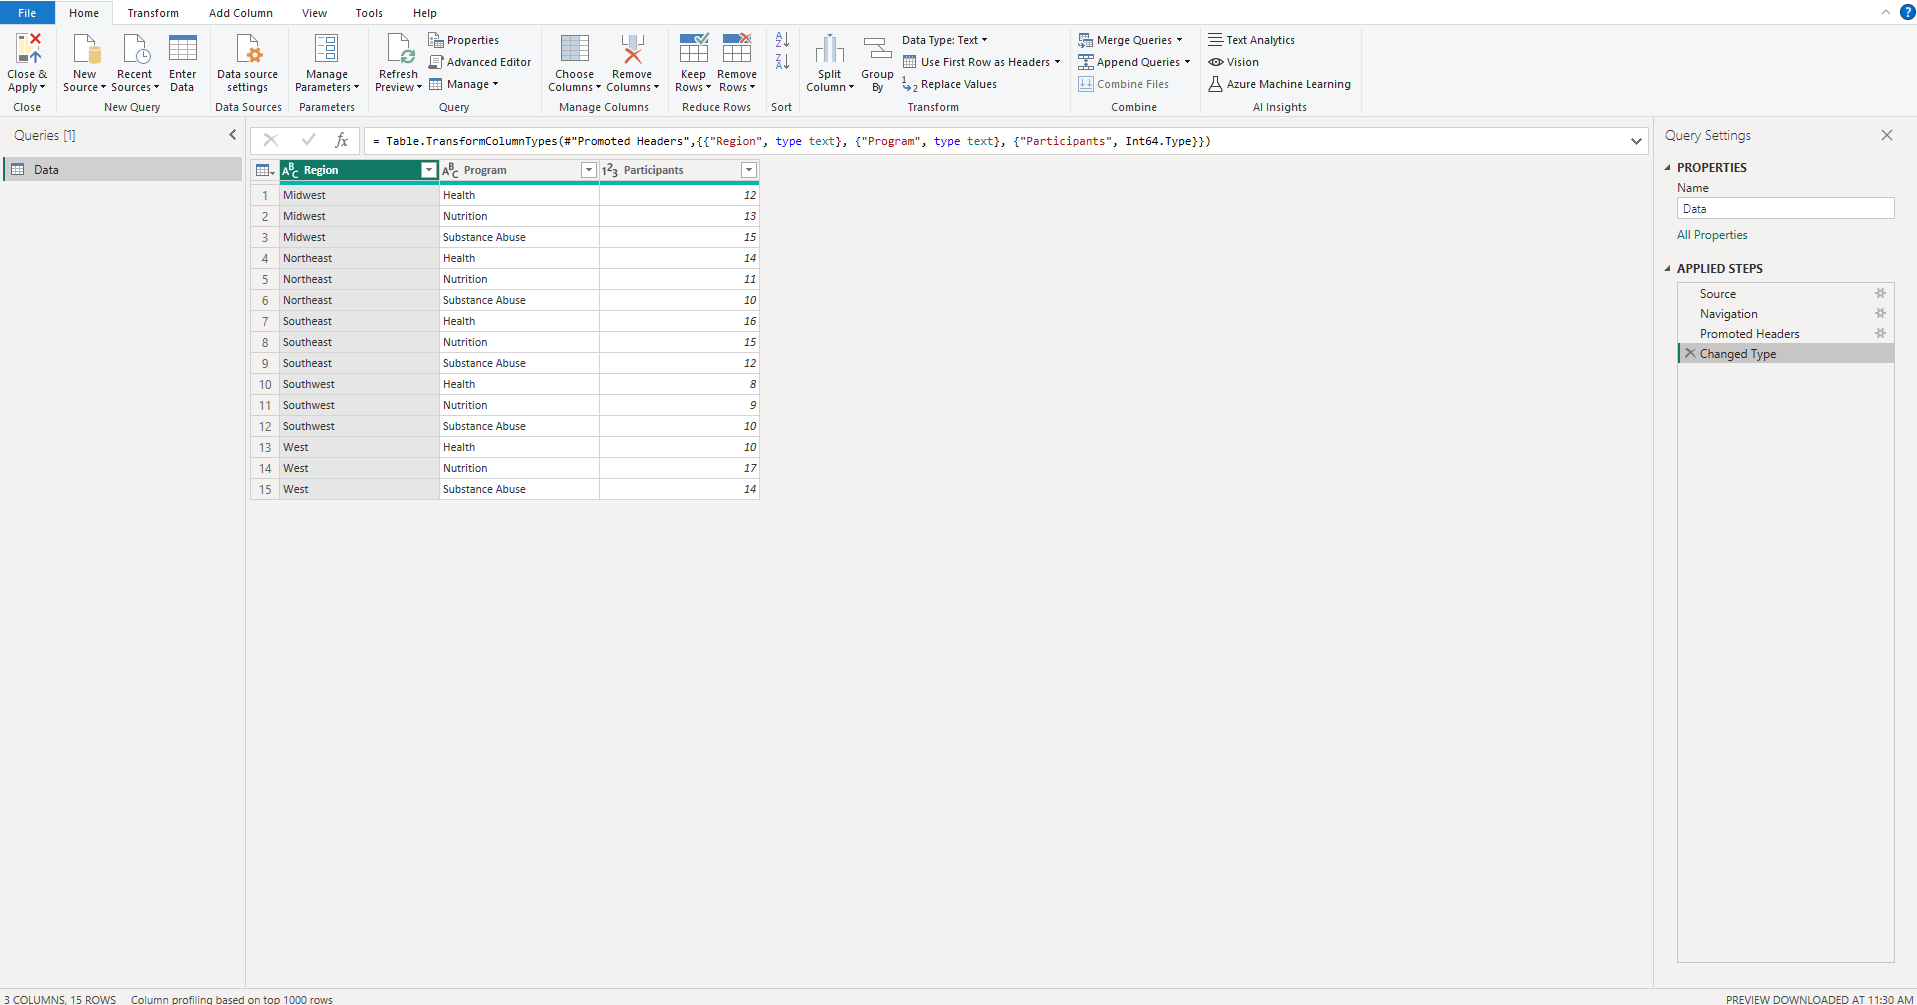
This post is just a brief introduction to Power Query Editor, so let’s do a quick tour of the user interface to get our bearings.
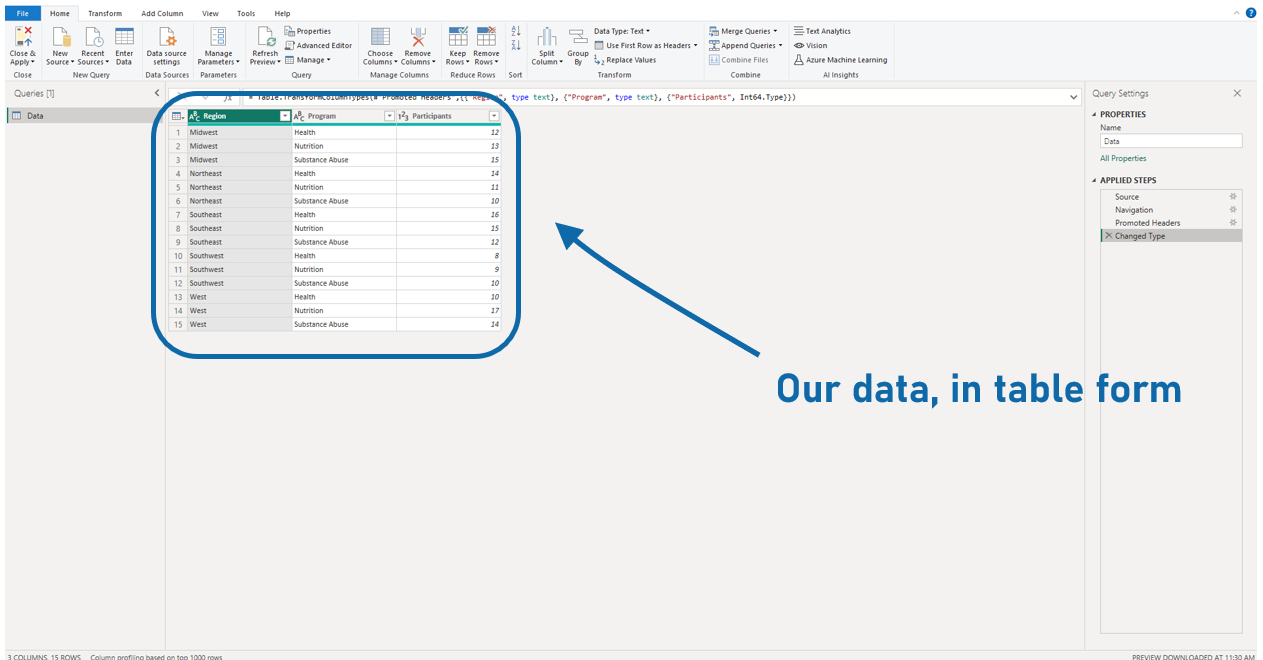
The main part of our screen is our Data View… we see the data we’ve connected in a table, very similar to how it would look if we viewed it in Excel.
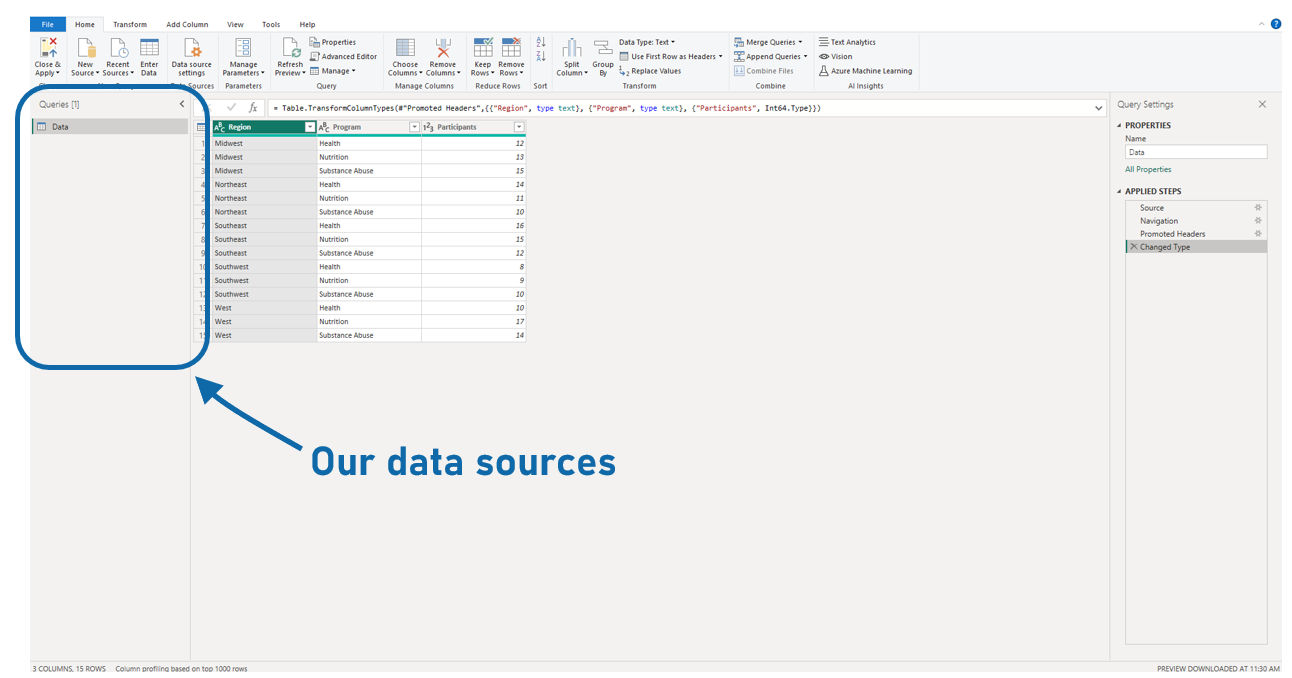
To the left is the “Queries Pane” which is where the data sources we’ve connected sit.
We’ve only connected one data source, so we’re only seeing one:
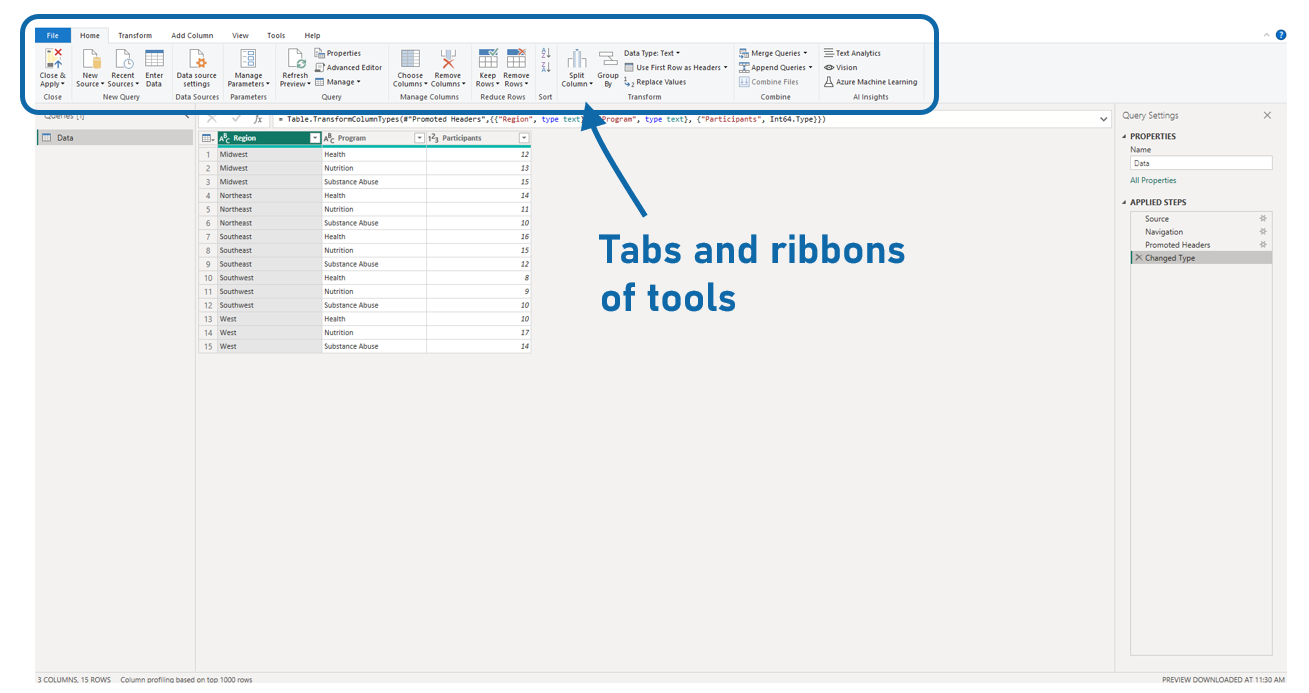
Along the top of Power Query Editor, we have tabs and ribbons with lots of tools (which we’ll explore in other posts), just like other Microsoft products like Excel, Powerpoint, and Word:
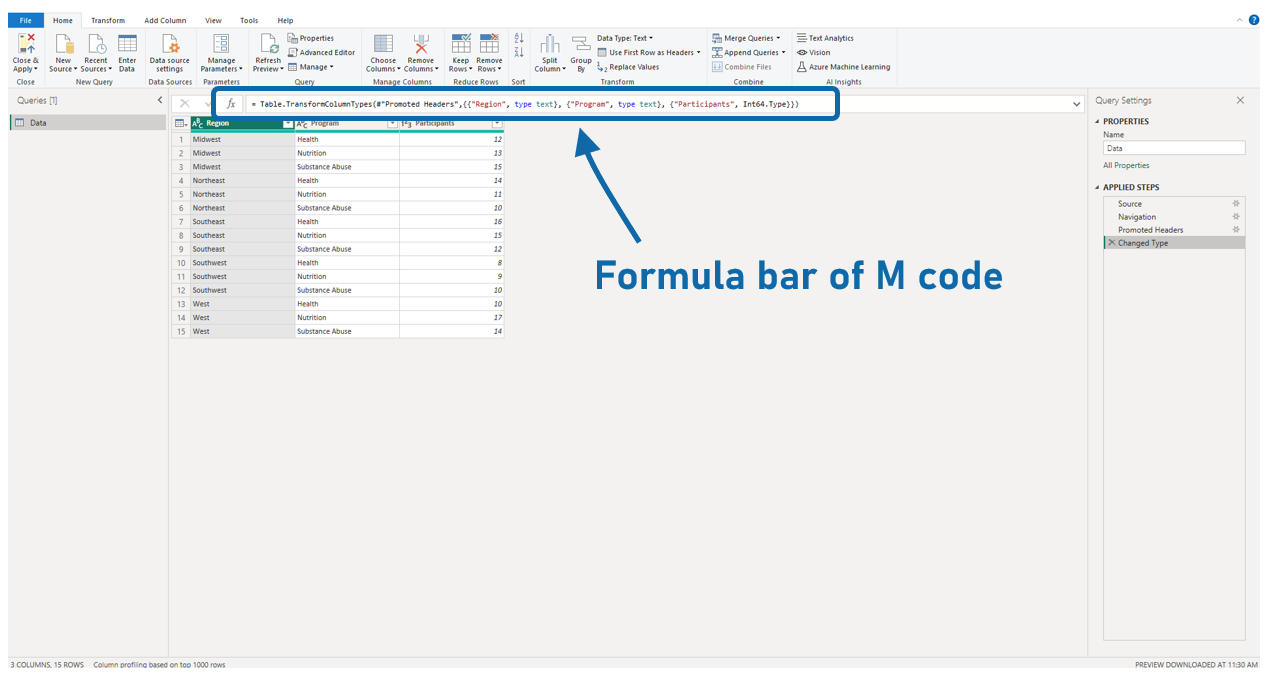
Right below our ribbon is probably the most confusing part of Power Query Editor when you’re starting out with it… the formula bar.
The formula bar displays bits of M code (M is the coding language Power Query uses to transform how Power BI reads your data source).. and it looks like another language (because it is).
M is super powerful, and we’ll explore how to use it in other posts, but for now you don’t need to worry about this formula bar.
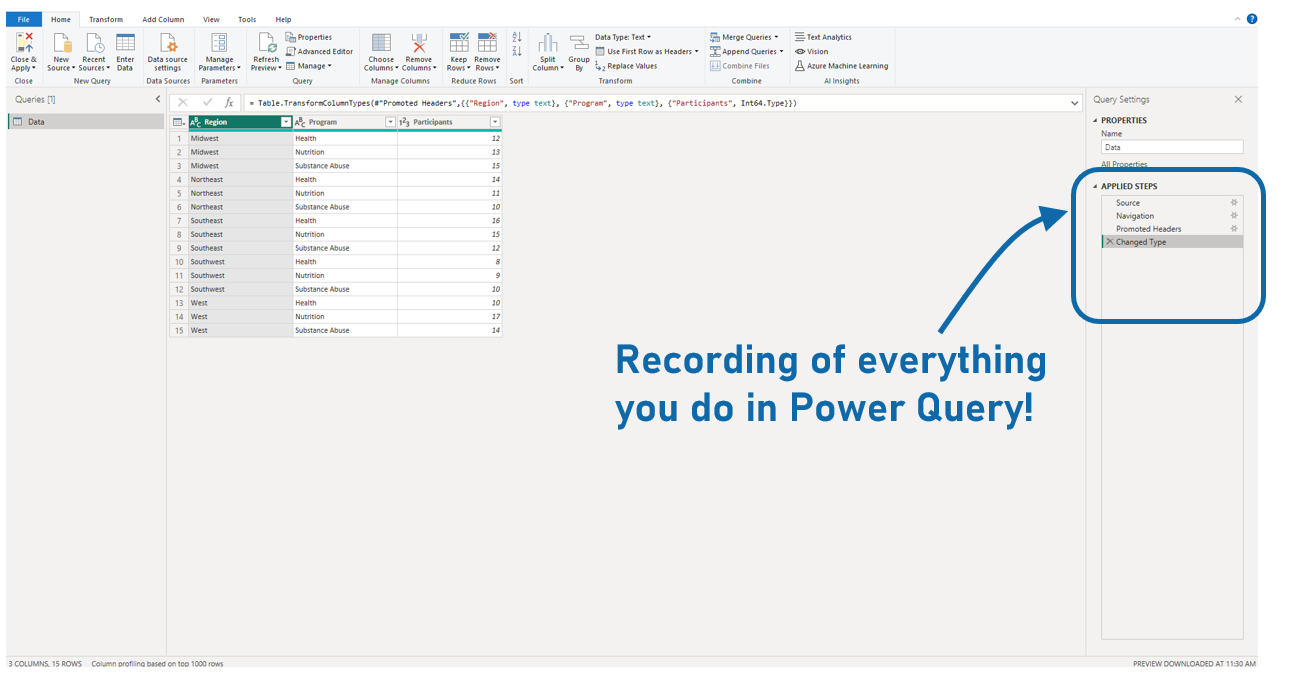
Finally, let’s have a quick look at the right side of the interface, at the Applied Steps section.
This section records any transformations we do in Power Query. If you tell Power BI to not bring in certain rows or columns, or to ignore duplicate rows of data (to use our examples from earlier), it’ll record those instructions here.
The big advantage to this is it remembers all your transformations. Then, if your data updates and you want Power BI to bring in new rows of data, it’ll apply all your transformations to your new data automatically. No need to do everything again!
That’s the basics of the interface.
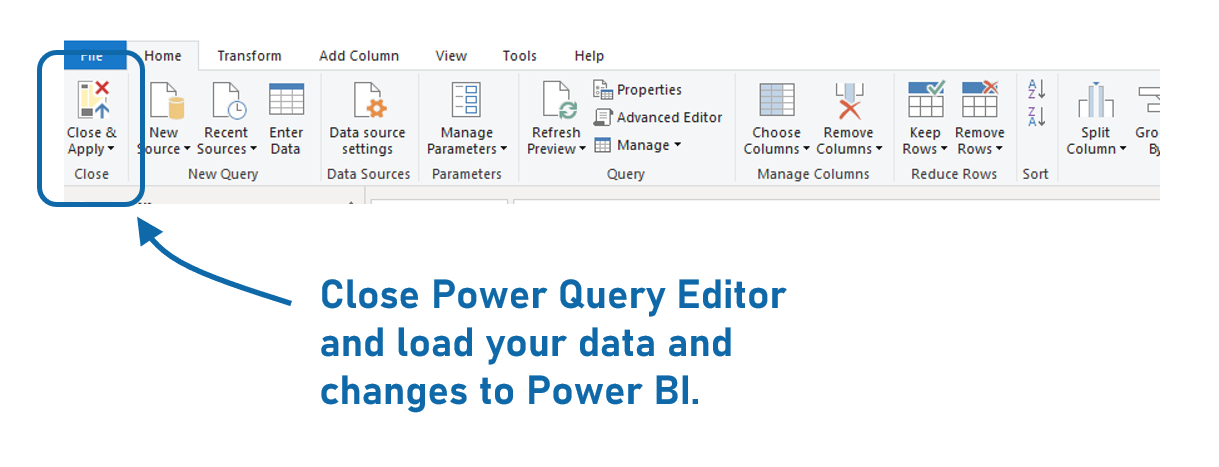
Let’s now click the “Close & Apply” button up at the very left of our ribbon to load our data to Power BI and explore a couple other ways to access Power Query Editor.
Once you’re in Power BI and working with your data to make visuals, you may find a need to clean or transform your data some more.
There are a couple ways to access Power Query Editor from inside Power BI Desktop.
One way is to click the Transform Data button up in the Home ribbon:
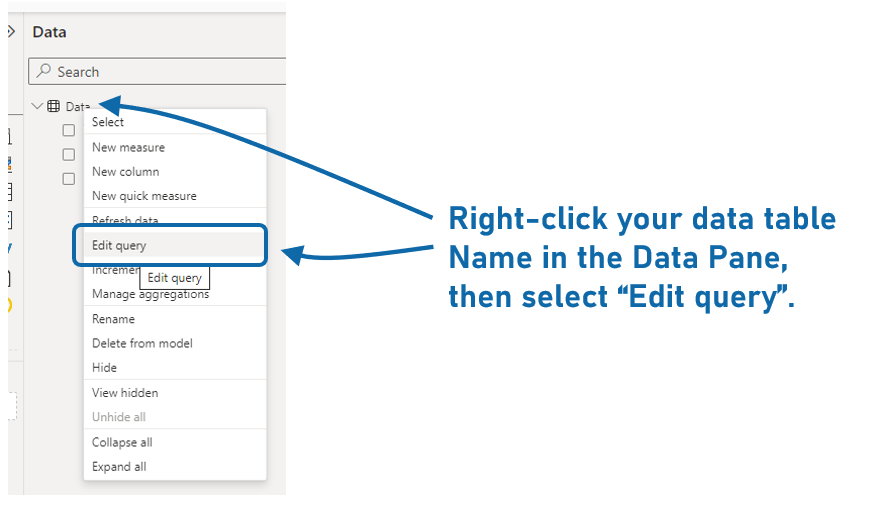
The other way is to right-click on your data table in the Data Pane at the very right side, and select “Edit Query”:
Those are the basics of Power Query Editor. It can do a million-and-one things and we’ll explore those in other posts.
Put your questions about Power Query editor in the comments below and we’ll figure it out together.
Take care,
Joe.
Post Tags: User Interface | Power Query | See all tags


