


Changing a Data Source
Changing a Data Source

Oh, we’re getting a bit fancy with Power BI in this post! We’re going to learn how to change the data source of a report, and what you need when you do this so that everything doesn’t break.
Not breaking things is a good goal, and not hard once you know what Power BI is doing when you make a data source change.
We’re going to use a Power BI report that already has a data source connected (and then we’re going to connect another one). You can download your own copy of the Power BI report here:

Here are the 2 Excel spreadsheets we’re going to use today.
First, the spreadsheet that has data identical to what the Power BI report above is connecting to.
Then, the spreadsheet that we’re going to connect to when we change the data source.
Got those? Cool. We’ll go through everything below in the video post and the write-up.
Video:
Written Instructions:
Okay, we’re starting off with a Power BI file that has data already connected. This data connection is called an “Import”, and what Power BI does with an Import is it connects with the data source and makes a little copy of the data to work with it. Also, even though it has made a copy of the data, it still maintains the connection in case we tell it there’s new data (or updated data) for it to check.
This report has a simple dataset connected/imported, and we’re going to explore how to switch this data source with another one.
To do this, let’s look at these two data sources:
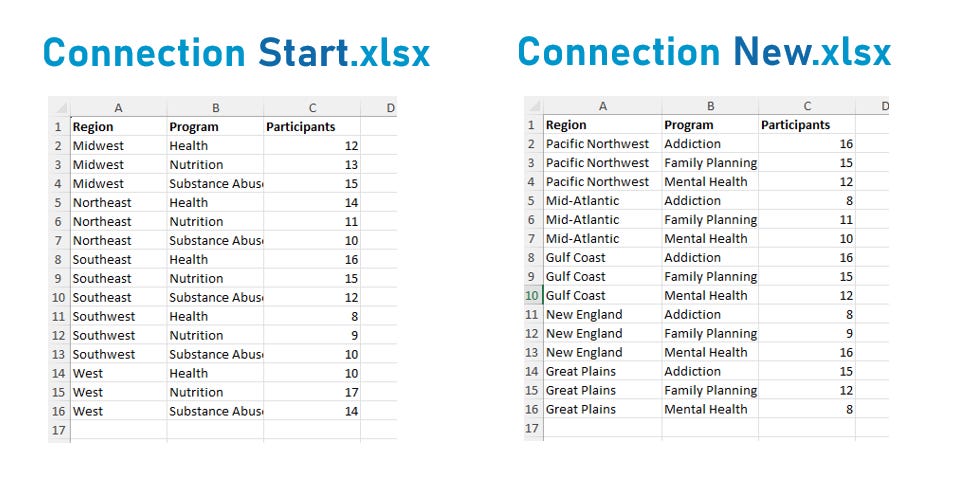
The one on the left is what our connected data source looks like, and the one on the right is the “new” source.
Let’s pay attention to some important things as we look at these.
The data rows are different (we have different regions and different programs and different participant numbers.
The data columns are IDENTICAL. Region, Program, and Participants. Nothing extra, nothing taken away, and each one is spelt and capitalized exactly the same.
This second observation is SUPER important. Power BI *loooooves* a stable structure in the data it connects to. You can change the data in the rows of your data source (within reason, like stay within the same format) no problem… Power BI can deal with it.
BUT, if you add a column, take away a column, change the name of a column, change the format of a column… Power BI won’t know how to read the data and your report will break. This is because when Power BI connects to a data source for the first time, it looks at how it’s structured.. what the columns are called, what format they are in, and then uses that information to display the data in Power BI Desktop so we can use it to make visualizations.
If we change the structure of our data (or connect a data source with a different structure), Power BI looks at the new source and basically says “What the hell is this? This is different data! I can’t work with this!” and basically throws a bunch of error messages at you.
So, for this simple post about switching a data source, our two data sources are structured exactly the same.
(Note: there ARE ways to let Power BI know how to read a new data structure. It can get complicated and requires some more advanced coding in a language called “M”, but for now, let’s keep things easy and breezy.)
When would switching a Power BI report using one data source to another with an identical data structure be something that would happen in real life? I’m glad you asked? It happens more than you think.
Think of an organization (or a department) that collects a ton of information and there are some natural divisions in that data. Different departments, different programs, different regions… all are collecting the same data, but each subset of data is only relevant to the department/program/region it’s about.
A good example could be data collected by a school board about all their schools. The data is all structured the same, but there are different collections of data for different schools.
By being able to easily switch a data source connected to a Power BI report, we can make ONE report and then change what school (or department, or region, or whatever) is populating that report.
It’s a super easy way to make an entirely new report with new data without re-doing everything.
Cool? Cool.
Okay, let’s do this.
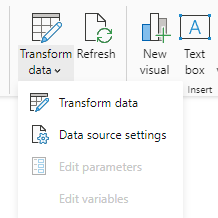
We have our report here with data connected. The excel file we’ve connected is called “Connection Start”. We can see the exact connection by clicking the “Transform data” text (NOT the little graphic), which gives us a little dropdown menu. We want to select the option that says “Data Source Settings”.
When that’s clicked we get a little Data Source Settings window that lists our data sources:
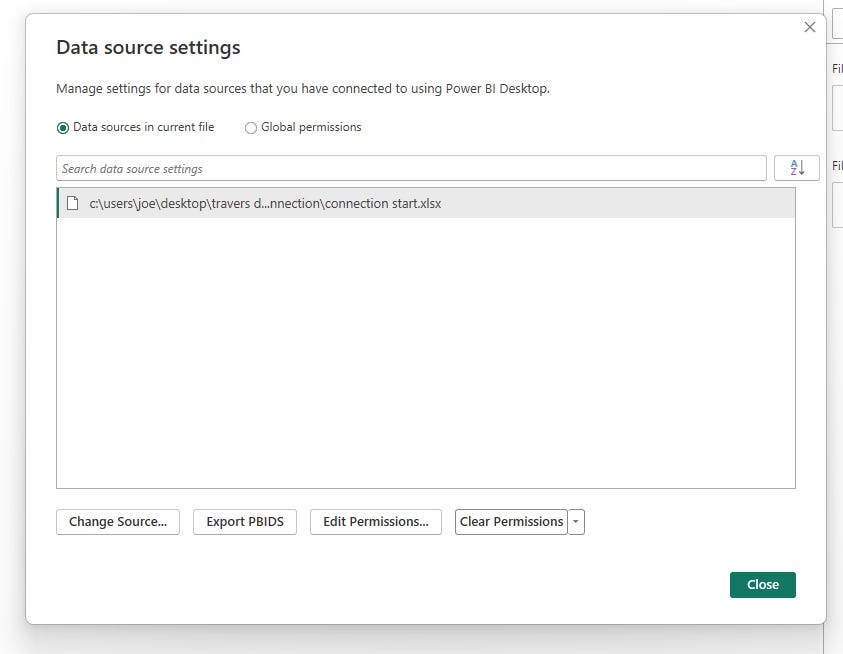
Only one source is showing up because we’ve only connected one. You can see the path is to an Excel file on my laptop, and the file name is “Connection Start.xlsx”.
Now, you can still use this data as is (even though it’s pointing to a file on my computer rather than yours), because, remember, Power BI made a little copy of the data and it’s stored in the .pbix file.
HOWEVER, if you had to transform or clean do something else with the data before (or while) visualizing it, you’d run into an issue. Power BI would try to connect to the source file using the above file path and give you an error (since you don’t have access to my laptop).
SO, we need to tell Power BI to connect to the “Connection Start” file that you downloaded to your laptop earlier.
Did you do that? If not, no worries, here’s the download link again.
Okay, so once you have that file downloaded (and it’s probably in your downloads folder), we can tell Power BI to connect to YOUR copy of this file.
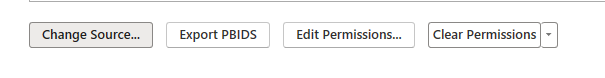
First, we’ll click on the data file path in our Data Source window. The background of it should turn grey:

Then we’ll click the “Change Source…” button at the bottom:
This opens up a window where you can browse to your copy of the “connection start” file.
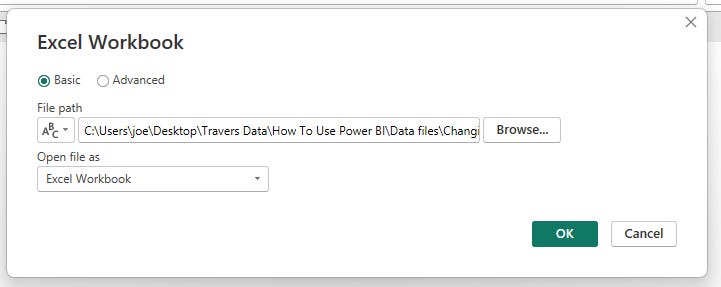
Click that “Browse” button and navigate to where you downloaded the “Connection Start” Excel file, select it, and click Open.

Now you should be back at that window with the “Browse” button, but you’ll see a new file path in the file path address. It will have a location on your computer rather than a location on my laptop.
Click the green OK button and you’ll go back to the Data Source Settings window, and you’ll see the new path showing up.
Click the green Close button.
It sends you back to your Power BI canvas, and you’ll likely see a message along the top that says “There are pending changes in your queries that haven’t been applied.” with buttons that say “Apply changes” and “Discard changes”.
This is basically asking “There’s a change in the data source! Did you change the data source? Is this cool? It’s cool, right?”.
It’s totally cool. Click “Apply changes”.
You won’t see any changes to your canvas or your data, because the data is exactly the same as my copy of the data.
Connecting to a totally NEW source:
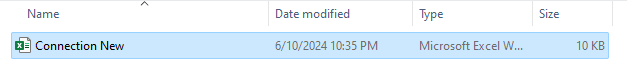
Let’s try connecting a totally NEW data source to our report now. We’re going to use a file named “connection new” for this. It’s the 2nd Excel file from the top of this post. It’s structured the same as our current file, but has different data in the rows. Different programs, different regions, and different numbers of participants.
If you didn’t download that Excel above, here it is:
We’re going to do the exact same thing as before… go up to the Transform Data dropdown in the Home ribbon, select “Data source settings”, select the path to our currently connected file and click “Change Source…”.
Then we click the “Browse” button and navigate to where our “Connection New” file is, select it, and click Open.
The path to this new file should be in that Browse window now. You can click OK.
The new path should be in your Data source settings window now. Click the Close button. Then click the “Apply Changes” button in the yellow bar that appears at the top of your canvas asking you if you want to apply the change you just made.
You’ll see your report completely change. All the visuals are the same, but the data populating them is totally new!
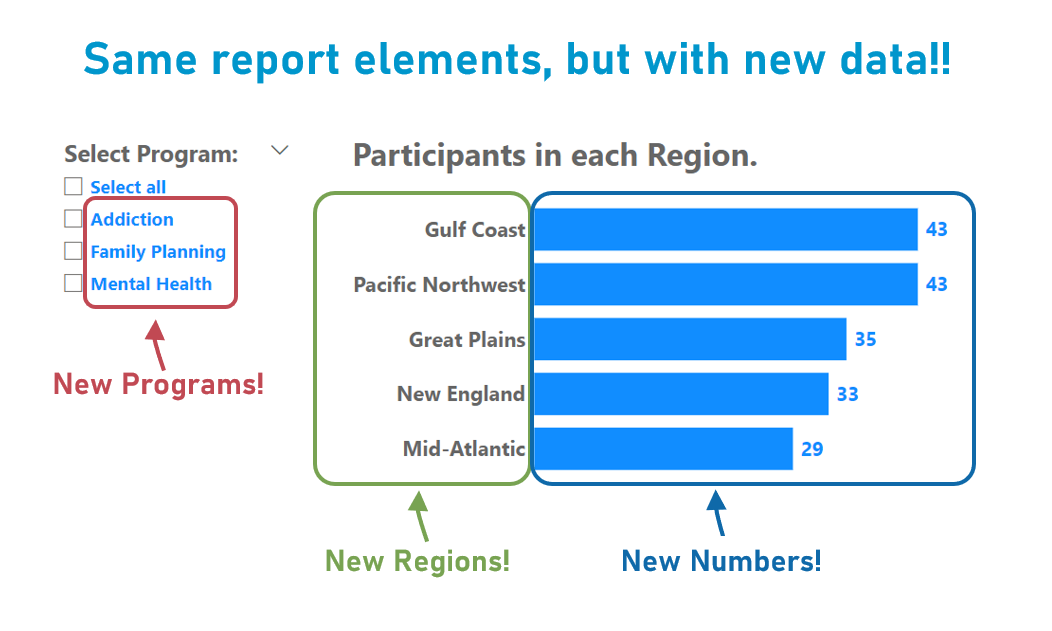
That’s all there is to it! If you have multiple sources of data that are structured the same (remember, same exact columns and column names), the source switching process is pretty easy!
Take care everyone,
Joe.
Post Tags: Connecting Data | View all Post Tags
Contact Joe | TraversData.com | People-Friendly Power BI | LinkedIn

This post was made with the May 2024 version of Power BI Desktop.