DAX: COUNT
The COUNT function in DAX is nice and easy. Let’s learn what it does (I think you can guess what it does) so we can all use it when we need it in our DAX measures.
We’re using a very simple dataset to learn the COUNT function.
If you’d like to use the same data that I do in the below video, here is the data file you can connect to a new blank report in Power BI Desktop:
Video:
Post:
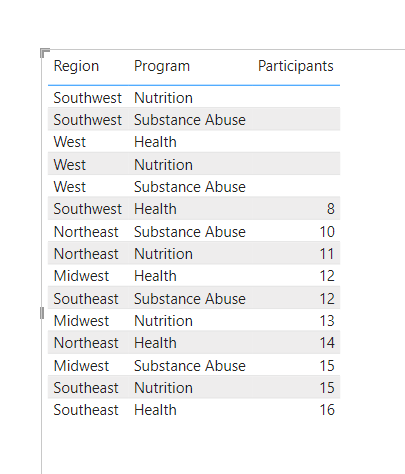
We’re going to start with a blank report that has our Excel spreadsheet connected. Our dataset is nice and simple with only 3 columns. Let’s bring them into a table visual and see what they look like.
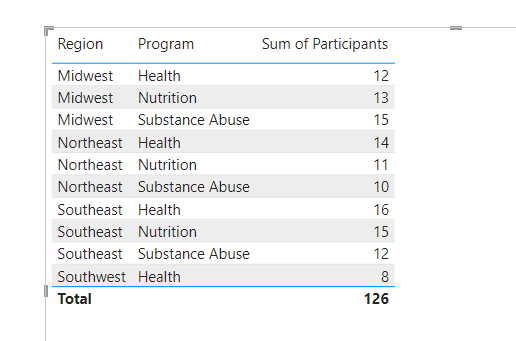
Here’s what the table looks like when we drag our columns into a table:
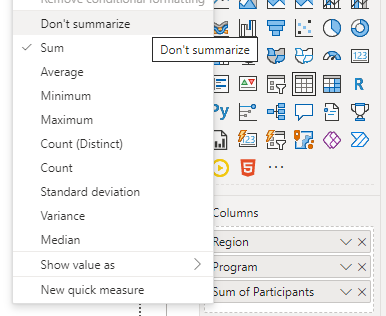
It looks okay, but Power BI aggregates things by default, so let’s right click on our columns that we’ve brought into the Columns box and make sure it’s not summarizing anything.
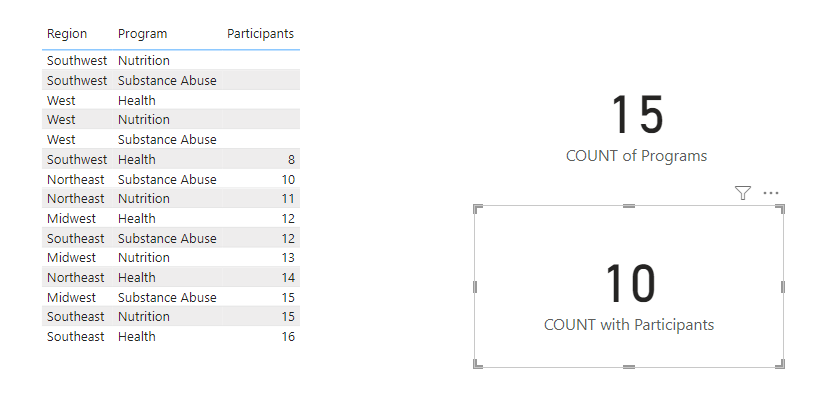
Our Participants field is being summed by Power BI, so for that one, select “Don’t Summarize” and you’ll see this in your table:
Some of our Programs don’t have Participants in them, but Power BI wasn’t showing them in the table. It’s something to look out for.
Okay, let’s see how the COUNT function works.
As you may have guessed, the COUNT function counts things. More specifically, it counts the presence of something in a column. Let’s see what we mean by that.
Let’s say we want to see how many times we have a Program in our Program column.
We’ll click “New Measure” up in the ribbon and write this DAX:
Nice and easy, right?
It’s the COUNT function, and then we’re telling it what it needs to count. We want it to count the instances of something in our Program column in our Data table.
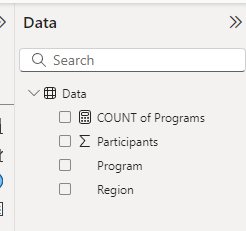
Hit enter, and you’ll get a new “COUNT of Programs” measure in your Data Pane.
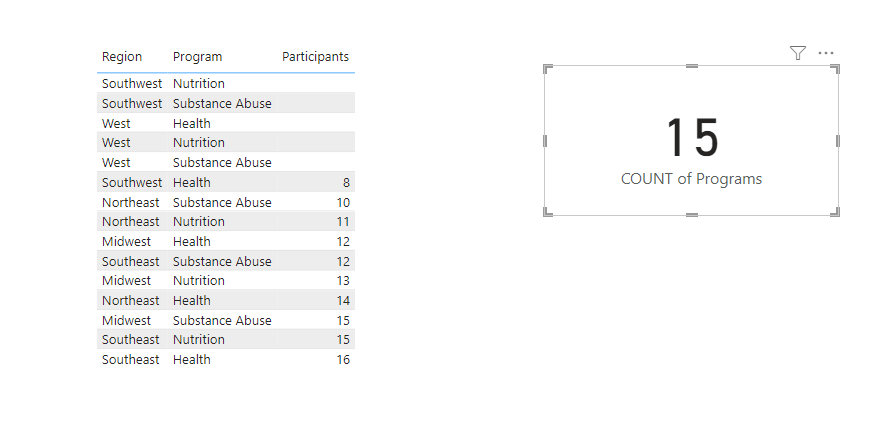
We can now bring that measure into a Card visual and see what our Count looks like.
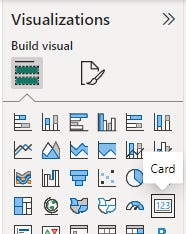
The card visual is the one that has a 123 in a box in the Visualizations Pane.
We’ll make sure nothing is selected on our Canvas, and then click the Card visual icon, making a Card space on our Canvas.
Then we can drag our new “Count of Programs” measure to that card.
Super. It’s counting up the 15 instances of a Program in our Program column.
Now, let’s try this on our Participants column. That one doesn’t have participants in every row. Some instances of our Programs (in the Southwest and West regions) don’t have participants. There is NO DATA in the Participants column in 5 of them.
Let’s create a new measure that counts the Participants column.
Click “New Measure” and write this DAX:
So, it’s the same thing as before, but this time we’re specifying another column.
Let’s drag this new measure into a card too and see what it gives us.
It’s counting up the 10 instances that have data. Just like we wanted.
That’s it. The COUNT function is super easy and straightforward. If you need a count of what’s in a column (perhaps part of another DAX measure), it gets the job done.
Let me know in the comments below if you have questions about the COUNT function, and I’ll help you figure it out.
Take care everyone,
Joe.
Post Tags: DAX | See all tags
Contact Joe | TraversData.com | People-Friendly Power BI | LinkedIn
This post was made with the June 2024 version of Power BI Desktop.


