DAX: SUM
Like these posts but need more formal (but still engaging and fun) training in Power BI? Or maybe there’s an issue that you need some Power BI support with…
Contact me, Joe Travers, at Travers Data or at joe@traversdata.com. I got you.
In this post we’ll explore how to write a simple SUM formula using DAX, and also show an example of how you may want to use it.
We’re going to use a very simple dataset and report to demonstrate how the SUM function works.
The written instructions as well the Power BI file and source data are linked below the video post.
Video:
If you’d like your own copy of the Power BI file I use in the above video, click here to download it.
If you’d like to use the same data that I do in the below video, here is the data file you can connect to Power BI Desktop:
Written Instructions:
Let’s learn about the SUM function by creating a simple table with our data.
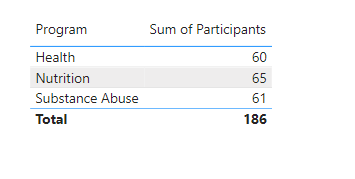
Click the Table visualization in the Visualization Pane, and then add the Program and Participants columns.
We can see that Power BI sums numeric fields by default, and in a table visual, it adds a default Total line at the bottom.
We would use the SUM function when we need to calculate a sum of all the numbers in a column.
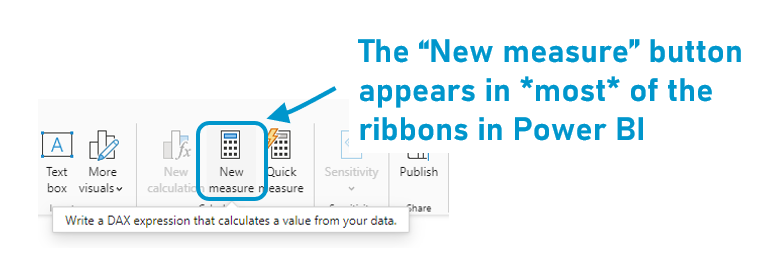
Let’s create a new measure either by clicking the New Measure button in the Home ribbon, or by right-clicking our data in the Data Pane and selecting New measure.
In the formula bar that shows up over our canvas, we’ll type some DAX.
First, type a measure name, like “Participant Sum”. Then type an equal sign (=) and then type the SUM function, and in parentheses we’ll put what column we want summed. Start typing “Data”, which is the name of our table, and Power BI will start guessing what we want to sum. Select or type “Data[Participants]” and close the parentheses.
PARTICIPANT SUM = SUM(Data[Participants])
(Note: I usually write my DAX titles in ALL CAPS, just to help set them apart from non-measures, but you don’t have to. It’s a personal choice)
Then hit enter to finish the measure.
So, this is summing everything in our Participants column.
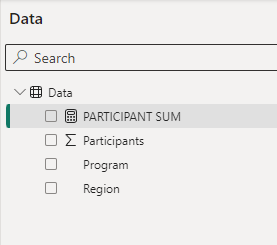
We can see our new measure show up in our Data Pane:
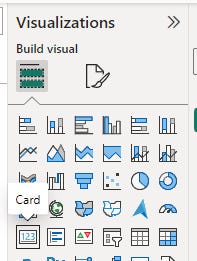
Let’s test it out by adding a Card Visual (which is the icon with a 123 in it) to our canvas, and then dragging our new DAX measure to it.
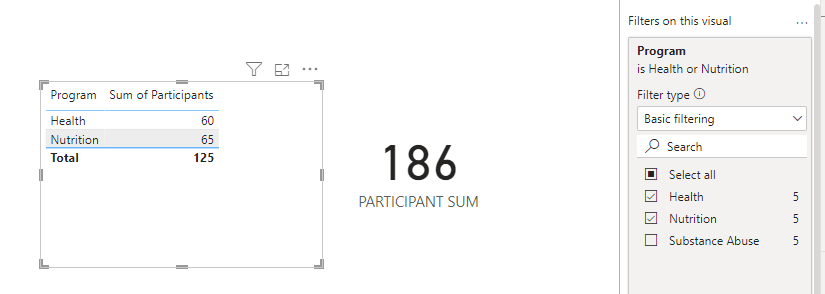
It is showing the total of all our participants, and it will always show it, unless we filter our card in any way.
For instance, if we select our Table and open our Filter Pane and open up the Program filter, and unselect “Substance Abuse” our table changes to only show Health and Nutrition but our card visual with our measure it still showing the total of everything.
This is *extremely* handy if you need an overall total (on your canvas, or in another calculation).
Let me know in the comments below if you have a question about the SUM function.
Take care everyone,
Joe.
Post Tags: DAX | See all tags
Like these posts but need more formal (but still engaging and fun) training in Power BI? Contact me, Joe Travers, at Travers Data or at joe@traversdata.com. I got you. :)
This post was made with the November 2023 version of Power BI Desktop.


